
DEFINITIVE 2026 SINGAPORE PROPERTY DISTRICT GUIDE
My first sale as a rookie property agent was a duplex penthouse at Sunrise Gardens in District 28. Far enough from Orchard Road that the postcode alone told you what mattered to the buyer.
What surprised me wasn’t the sale itself. It was realising how much the district number shaped the buyer’s decision. They had viewed smaller units closer to town, but District 28 offered space — and that mattered more than being central. The postcode wasn’t just administrative; it was decisive.
That was when I began to pay closer attention to how Singapore’s 28 districts actually function.
They aren’t arbitrary. Introduced in the 1950s as part of Singapore’s postal system, these districts evolved into something far more functional — a pricing map, a signal of location value, a shorthand for lifestyle trade-offs.
These 28 districts classify private properties in Singapore. This system is entirely different from public housing, where HDB flats are organised into self-contained towns. And while the districts began as mere geography, they’ve since grown into a framework that influences buyer behaviour, investment strategy, and, in the end, price.
Understanding each Singapore district isn’t about memorising numbers. It’s about recognising what you’re really choosing when you pick one location over another. Space versus status, commute versus lifestyle, yield versus future upside.
On this page:
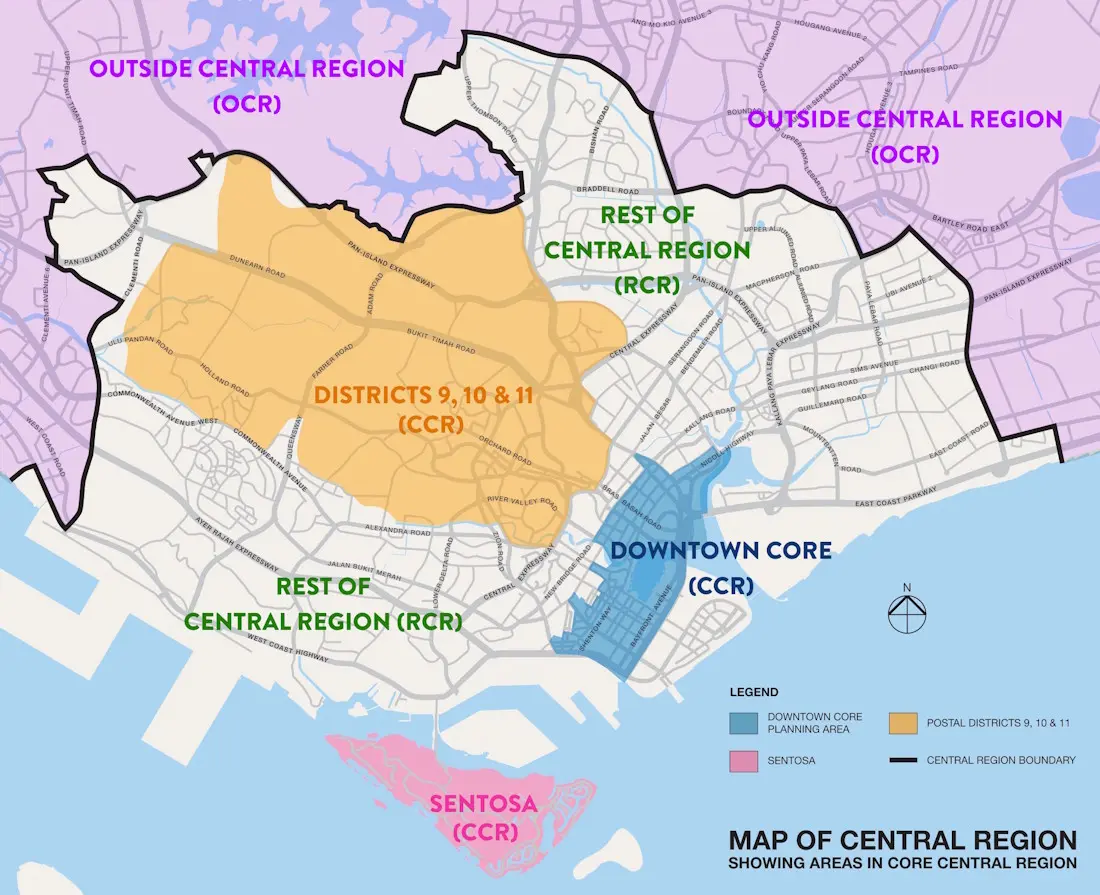
HOW CCR, RCR & OCR CAME TO BE
The 28 districts are just the first layer. In January 2007, the URA (Urban Redevelopment Authority) introduced a second way of grouping locations: CCR, RCR, and RCR. These three macro regions group locations by market behaviour & pricing patterns, rather than just geography.
While each Singapore district has clear boundaries, the CCR, RCR, and OCR regions don’t align perfectly with them.
Sentosa, Telok Blangah & Harbourfront are in district 4. Sentosa is classified as CCR, while the latter two fall under the RCR.
It’s a reminder that in the Singapore property, value can shift within the same district, sometimes street by street.
If you follow URA’s media releases or analyst reports, you’ll notice that price indices are almost always framed around these three regions. Learning how they work is one of the fastest ways to read Singapore’s private housing numbers with more confidence.
A CLIENT’S PERSPECTIVE
Jack stood out because of his attentiveness & ability to understand our needs.
Jack also gave us a comprehensive introduction to the Singapore housing market & helped us navigate it every step of the way.
Dr Trin Dong
Physician
New York, United States
For many overseas buyers, this blend of data, context and local nuance is what makes the Singapore district system understandable — and usable.
CORE CENTRAL REGION (CCR)
The Core Central Region (CCR) is where Singapore’s property market commands its highest prices — not always because the apartments are bigger or newer, but because the postcode carries weight.
Orchard Road. Tanglin. River Valley. Bukit Timah. Newton. Marina Bay. Ocean Drive.
These aren’t just addresses — they’re names people recognise instantly, the ones that signal prestige.
The CCR primarily covers Districts 9, 10 and 11, plus parts of Districts 1, 2, 4, 6 and 7, the Downtown Core and Sentosa.
What drives the premium here:
- proximity to the Central Business District and financial institutions
- Access to popular international and local schools
- Luxury retail, dining and lifestyle clusters
- Embassies and exclusive residential enclaves
- Scarcity of land in these postcodes, which keeps the supply limited
The trade-off is space. Across Singapore, newer projects tend to have smaller units as land and construction costs rise, and the CCR is no exception.
Older developments here are typically more spacious, but they’re becoming rarer as many have been sold through en bloc sales over the years. Still, centrality and status hold their value, whether you’re living in the property, renting it out, or selling years down the road.
From a practical point of view, the CCR often suits:
- High-income executives or business owners who want short commutes to their offices in the CBD
- Families looking for top schools and established neighbourhoods
- Investors who treat prime Singapore districts as a store of value across market cycles.
REST OF CENTRAL REGION (RCR)
The Rest of Central Region (RCR) wraps around the core and extends outward — close enough to matter, far enough to offer better value.
It includes Districts 3, 8 and 12, plus parts of Districts 1, 2, 4, 5, 6, 7, 13, 14, 15 and 20.
That covers neighbourhoods such as Tiong Bahru, Queenstown, Kallang, Geylang, Marine Parade, East Coast, Toa Payoh, and Bishan. You’re still within a reasonable distance from town, but without paying the full CCR premium.
What makes the RCR compelling is its variety:
- Tiong Bahru feels nothing like Geylang
- East Coast feels nothing like Bishan
- Alexandra and Queenstown are very different from Potong Pasir or MacPherson
There’s no single RCR identity—just a collection of distinct neighbourhoods, each with its own character, tenant profile and price behaviour.
For many buyers, this region represents balance:
- Proximity without the CCR premium
- Space without the OCR commute
- Neighbourhoods that have been around long enough to feel settled
For investors, the RCR often offers:
- Strong rental demand from CBD and city-fringe workers
- A wide range of quantum-friendly one- and two-bedders
- Projects that benefit from ongoing MRT and amenity upgrades
OUTSIDE CENTRAL REGION (OCR)
The Outside Central Region (OCR) covers Districts 16–19 and 21–28, plus parts of Districts 5, 14, 15 and 20 — areas like Tampines, Punggol, Sengkang, Woodlands, Jurong, Pasir Ris, Sembawang and Choa Chu Kang.
As prices in the CCR and RCR continue climbing, the OCR’s value proposition becomes clearer:
- More space for the same money
- Family-friendly town planning
- Neighbourhoods are built around parks, waterfronts, and community amenities rather than office towers.
The space difference is tangible. What you get in the OCR versus the CCR/RCR, for the same budget, often means an extra bedroom or a layout that truly fits family life.
This is also where ECs (executive condominiums) are built, primarily because land marked for ECs is less expensive and intended for the “sandwiched class”. Over the years, ECs here have consistently delivered strong returns when owners eventually sell, making the OCR not just a lifestyle choice but also a calculated investment move for those who qualify and are willing to hold.
The trade-off is distance and prestige. It’s further from the CBD, and the address doesn’t carry the same weight. But rental yields can be competitive, and for those prioritising practical value over status, the numbers make sense.
WHY THESE REGIONS MATTER
CCR, RCR and OCR aren’t just URA classifications.
They explain why similar-sized apartments in different regions command vastly different prices, and they influence:
- Rental demand and tenant profiles
- Resale potential and exit strategies
- Cash outlay, loan quantum, stamp duty bracket and property tax
- The type of buyer each Singapore district tends to attract
In real estate, value is never universal — it’s shaped by local demand, buyer behaviour, and constraints.
In Singapore, CCR / RCR / OCR is one of the clearest frameworks for understanding those local differences.
Understanding them isn’t about memorising district boundaries. It’s about knowing what drives value in each zone — and what trade-offs come with every location decision, whether you’re signing a lease, listing a property or holding for the long term.
How have prices moved in each region?
The chart below tracks the Private Residential Property Price Index for CCR, RCR and OCR. This index measures the percentage change from a baseline. Not actual prices.
So if CCR shows a lower index than OCR, it doesn’t mean CCR is cheaper. It means CCR prices have grown less (in percentage terms) from the starting point – a key nuance when comparing Singapore district performance across regions.
INTERACTIVE SINGAPORE DISTRICT MAPS
Regions show broad pricing patterns and market behavior. But transactions happen at the district level, where specific developments, infrastructure, and micro-market dynamics shape what actually moves.
The interactive maps on this page are updated every quarter with current transaction data for Singapore private homes (condos only, both resale & new launches).
- On desktop, you can hover over each Singapore district to see its average PSF & transaction volume
- On mobile, you can tap districts to explore further
It’s not commentary. It’s what’s actually happening in each district right now.
Click on any district to see the full breakdown:
- Sales and rental trends
- Transaction history
- Top developments by activity
- Comparisons with neighbouring districts
Because property decisions are better made with data than assumptions.
SALES TREND BY DISTRICT
2025 Full Year Stats
RENTAL TREND BY DISTRICT
2025 Full Year Stats
SINGAPORE’S PROPERTY MARKET IN 100 HOMES
Ever wonder what the market looks like when you zoom all the way out?
Here’s one way to picture it: shrink all transactions down to just 100 homes, then see how they break down.
The interactive “100 homes” visual lets you guess the numbers first, then reveal the actual breakdown. Move your mouse to guess the number of homes and click to check the correct answer.
IF 100 HOMES WERE SOLD, HOW MANY…
2026 EDITION
Move your mouse to guess the number of homes and click to check the correct answer.
How did you do? Are you surprised by the results?
Each of the 28 Singapore districts has its own 100-home trivia waiting.
Click any district in the table below or maps on this page to explore deeper trends, insights, and neighbourhood-level trivia. This is a simple way to build intuition about how each Singapore district behaves in real life.
SINGAPORE’S POSTAL DISTRICT IDENTITY
Every Singapore district has:
- A postal code range
- A set of neighbourhoods and landmarks
- A reputation – earned, inherited, or still evolving
The list below maps all 28 Singapore districts to their postal sectors, key landmarks, and general character. Some boundaries make perfect sense; others feel arbitrary — until you compare transaction data across neighbouring postcodes and realise that a single street can mean a significant price difference.
Use this as a reference when you’re:
- Evaluating listings from different property portals
- Comparing PSF across projects
- Trying to understand why similar units 2km apart transact at very different values
THE 28 POSTAL DISTRICTS AT A GLANCE
| Postal District | Postal Sector (1st 2 digits) | Key Landmarks | Character |
|---|---|---|---|
| 01 | 01, 02, 03, 04, 05, 06 | Marina Bay Sands, Lau Pa Sat, Clifford Pier | Singapore’s financial heart. Iconic skyline, global business hub, corporate dominance |
| 02 | 07, 08 | Tanjong Pagar Railway Station, Duxton Hill, Tanjong Pagar Plaza | Cultural precinct. CBD’s dining & nightlife heart. |
| 03 | 14, 15, 16 | Leng Kee Car Showrooms, IKEA Alexandra, Old Tiong Bahru Estate | Heritage flats. Trendy & charming old HDB estate. |
| 04 | 09, 10 | Mt Faber Park, VivoCity, HarbourFront Centre, Sentosa | Seafront condos & resort-style living. Marina berths. Hilltop greenery. |
| 05 | 11, 12, 13 | Pasir Panjang Wholesale Centre, Google, NUS, NUH | Knowledge & innovation corridor. Suburban charm. |
| 06 | 17 | National Gallery Singapore, Fort Canning, Capitol Theatre, Central Fire Station, St Andrew’s Cathedral | Civic & cultural heart. Timeless elegance. Limited housing supply. |
| 07 | 18, 19 | Sultan Mosque, Raffles Hotel, National Library, Bugis, NAFA, Kampong Glam | Artistic energy, heritage charm. |
| 08 | 20, 21 | Little India, Mustafa Centre, Farrer Park, Sri Srinivasa Perumal Temple | Vibrant ethnic enclave. 24-hour buzz. |
| 09 | 22, 23 | Orchard Shopping Belt, 38 Oxley, Newton Food Centre, YMCA | Luxury shopping, fine dining. Expats haven. |
| 10 | 24, 25, 26, 27 | Singapore Botanic Garden, Dempsey Hill, Holland Village | Leafy & laid-back. Lifestyle cafes. |
| 11 | 28, 29, 30 | Novena Medical Centre, United Square, IRAS Revenue House, Novena Church | Healthcare hub. Prime landed houses. Top schools. |
| 12 | 31, 32, 33 | MOE Heritage Centre, Balestier Lighting Shops, Lian Shan Shuang Lin Monastery | Established HDB towns. Heritage food hub. |
| 13 | 34, 35, 36, 37 | Macpherson Shophouses, Stamford American International School, Woodleigh Waterworks | Neighbourhood with light industrial spaces. |
| 14 | 38, 39, 40, 41 | Geylang, National Stadium, Geylang Serai Market, Singapore Post Centre | Vibrant, multicultural vibe. Emerging business & retail node. |
| 15 | 42, 43, 44, 45 | East Coast Park, Parkway Parade, Singapore Swimming Club, Chung Cheng High School | Beachfront lifestyle. Rich Peranakan heritage. Multicultural residential haven. |
| 16 | 46, 47, 48 | Laguna Golf Club, Bedok Sports Hall, Bedok Reservoir, National Sailing Centre | Suburban tranquility. Good mix of landed houses, condos & HDBs. |
| 17 | 49, 50, 81 | Changi Village, Changi Airport, Changi Sailing Club | Light industrial parks. Laid back vibe. |
| 18 | 51, 52 | Masjid Darul Ghufran, Downtown East, Our Tampines Hub, Pasir Ris Park, Tampines Regional Centre | East’s regional centre. Family-friendly. |
| 19 | 53, 54, 55, 82 | Chomp Chomp, Punggol Waterway Park, Coney Island, Serangoon Gardens Country Club | Balanced heartland. Family-oriented suburban hub. |
| 20 | 56, 57 | Kong Meng San Phor Kark See Monastery, Lower Pierce Reservoir, Masjid Al-Muttaqin | Harmonious blend of nature and urban convenience. |
| 21 | 58, 59 | Rail Corridor, Clementi Forest Nature Park, Beauty World, Bukit Timah Hill | Low density landed estates. Lush greenery. |
| 22 | 60, 61, 62, 63, 64 | Singapore Science Centre, Tuas Mega Port, Jurong Lake Garden, IMM, NTU | Western gateway. Singapore’s 2nd CBD. |
| 23 | 65, 66, 67, 68 | Dairy Farm Nature Park, Pang Sua Pond, Little Guilin, Seng Chew Quarry, MINDEF Gombak | Quiet residential pocket. Green corridors. |
| 24 | 69, 70, 71 | Sungei Buloh Wetland Reserve, Qing Hu Fish Farm, The Animal Lodge, Hay Dairies | Newest HDB town. The “Forest Town”. Singapore’s verdant rural-urban frontier. |
| 25 | 72, 73 | Woodlands Checkpoint, Kranji Marshes, Mandai Wildlife Reserve, Woodlands Waterfront Park | Northern gateway. North Coast Innovation Corridor Hub. Smart industrial parks. |
| 26 | 77, 78 | Upper Peirce Reservoir Park, Springleaf Nature Park, Seletar Rocket Tower | Leafy nature sanctuary. |
| 27 | 75, 76 | Sembawang Hot Spring Park, Beaulieu House, Yishun Dam, Yishun Pond Park | The northern mix. Heartland living, waterfront leisure, and light industry coexisting in balance. |
| 28 | 79, 80 | Seletar, Wheeler’s Estate, Jalan Kayu Prata | Aerospace hub. Rustic charm. |
Together, these 28 districts form the basic vocabulary of the Singapore property market. When someone says “District 9” or “District 15”, they are pointing to more than a spot on the map — they’re signalling price bands, lifestyle, tenant mix and long-term expectations.
Explore in-depth guides for these Singapore districts by clicking on the district numbers in the table above.
HOW TO READ A POSTAL CODE & FIND ITS SINGAPORE DISTRICT
If you have a listing or address and want to know which Singapore district it sits in, the process is straightforward once you know what to look for.
- Find the six-digit postal code
You’ll see this on property portals, brochures, tenancy agreements or the URA site. - Look at the first two digits
These two digits are the postal sector. For example, in postal code 238801, the sector is 23. - Match the sector to the district
Use the table above to match, e.g. sectors 22–23 belong to District 9, so 238801 is in District 9. - Map the district to CCR / RCR / OCR
- Districts 9, 10, 11 and parts of 1, 2, 4, 6, 7 sit in the CCR
- Districts 3, 8, 12 and parts of 1, 2, 4, 5, 6, 7, 13, 14, 15, 20 sit in the RCR
- Districts 16–19, 21–28 and parts of 5, 14, 15, 20 fall under the OCR
- Go one step deeper
Once you know the Singapore district and region, compare:- Recent PSF in that district versus neighbouring districts
- Rental demand profiles from similar projects nearby
- Government master plans affecting that area
This simple habit — starting with the postal code, then moving through sector, district and region — helps you read any Singapore district in a more structured way, instead of relying on gut feel alone.
SPLIT DISTRICTS
One important nuance the URA highlights is that district boundaries do not always align neatly with CCR, RCR, and OCR boundaries.
Several Singapore districts are split across regions:
- District 4 – Sentosa is classified as CCR, while Telok Blangah and Harbourfront sit in the RCR
- District 5 – Pasir Panjang is in the RCR, while Clementi New Town and parts of West Coast are in the OCR
- District 14 – Some areas, such as Paya Lebar and Geylang, are classed under RCR, while Kembangan and Kaki Bukit fall under OCR
- District 15 – Tanjong Rhu and parts of Marine Parade are RCR, while Siglap and Frankel are typically grouped with the OCR
- District 20 – Bishan and Thomson sit in the RCR, while parts of Ang Mo Kio are OCR
What this means in practice:
- Two homes in the same Singapore district can have different regional classifications
- PSF, rental yields and buyer profiles may differ even within one district
- Future upside can hinge on which side of a planning line your project sits on
When you evaluate a home, don’t stop at “it’s in District 5” or “District 15”. Ask:
- Is this part considered CCR, RCR or OCR?
- How does that affect loan limits, pricing benchmarks and exit pool?
- Are buyers here comparing it to projects in the next district or across the island?
Reading the Singapore district system at this micro level often yields better-aligned buys. Especially for investors and HDB upgraders looking beyond headline marketing.
SINGAPORE DISTRICTS VS CDC DISTRICTS
Beyond postal districts and URA regions, Singapore is also divided into five Community Development Council (CDC) districts:
- Central Singapore
- North East
- North West
- South East
- South West
These CDC districts:
- Are drawn based on political constituencies, not postal codes
- Exist to run community programmes and social support, not to price property
- Often cut across multiple Singapore districts and towns
You might see both systems mentioned in different contexts — for example, a community event in the “North East District” versus a condo brochure highlighting “District 19”. They are two separate & distinct frameworks.
For property decisions, the 28 postal districts and CCR / RCR / OCR are the ones that matter most. The CDC framework is useful for understanding local community activities, but it doesn’t determine how a Singapore district is valued in the market.
WHERE DISTRICTS TAKE YOU
That duplex penthouse at Sunrise Gardens in District 28 was just the beginning. Since then, I’ve transacted across all three regions and most districts, working with both local and international clients alike.
What I’ve learnt is that a Singapore district number is never just a postcode. It’s shorthand for what people value:
- Space over status
- Convenience over calm
- Rental yield over capital appreciation
- Accessibility over exclusivity.
The 28 districts aren’t just lines on a map. They are trade-offs, made visible.
Explore individual district pages for transaction trends and quarterly updates, or use the interactive maps above to see how each Singapore district is performing this year.
Property decisions are better made with context than assumptions — and with someone willing to walk you through both the numbers and the narratives behind them.
FREQUENTLY ASKED QUESTIONS
1) What are the 28 Singapore property districts?
Singapore’s 28 postal districts are a classification system introduced in the 1950s that has since evolved into a pricing map and lifestyle shorthand for the private residential property market.
They range from District 1 in the financial heart of the city to District 28 in the rustic northeast. Each district covers a set of neighbourhoods with distinct character, price behaviour and tenant profiles. This system applies only to private properties. HDB public housing uses a separate town-based classification.
2) What is the difference between CCR, RCR and OCR in Singapore property?
CCR (Core Central Region), RCR (Rest of Central Region) and OCR (Outside Central Region) are three macro-regions introduced by the URA in January 2007 to group Singapore districts by market behaviour and pricing patterns rather than geography alone.
The CCR covers the most prestigious districts including 9, 10, 11, parts of 1, 2, 4, 6, 7, the Downtown Core and Sentosa, and commands the highest prices. The RCR wraps around the core and includes districts such as Tiong Bahru, Queenstown, East Coast and Toa Payoh, offering proximity to the city at a lower premium. The OCR covers the remaining districts further from the CBD.
Areas like Tampines, Punggol, Woodlands and Jurong, where buyers typically get more space for their budget.
3) How do I find which Singapore district a property belongs to?
Take the six-digit postal code of the property and look at the first two digits — this is the postal sector. Match the sector to the corresponding district using a postal district reference table.
For example, a postal code starting with 23 falls under District 9 (Orchard, River Valley, Cairnhill). Once you know the district, you can also determine whether the property sits in the CCR, RCR or OCR.
4) Which Singapore district is the most expensive?
Districts 9, 10 and 11 consistently rank among the most expensive in Singapore, forming the core of the CCR. District 9 covers Orchard Road and River Valley; District 10 covers Holland, Tanglin and Bukit Timah; and District 11 covers Newton and Novena.
Sentosa in District 4 also commands very high prices due to its resort-style positioning. However, price per square foot can vary significantly even within a single district, sometimes shifting between CCR and RCR classifications street by street.
5) What is the difference between Singapore postal districts and CDC districts?
Singapore’s 28 postal districts are a property and postal classification system used for private residential real estate. CDC (Community Development Council) districts are a separate administrative grouping used for community services, social programmes and government support schemes.
The two systems have different boundaries and serve entirely different purposes. When researching property, always refer to the postal district system.
6) Are Singapore’s property districts the same as HDB towns?
No. Singapore’s 28 postal districts apply to private residential property such as condominiums and landed houses. HDB public housing flats are organised into a separate system of self-contained towns such as Tampines, Ang Mo Kio and Woodlands. While some HDB towns overlap geographically with property districts, the two systems are distinct and should not be used interchangeably when researching the property market.

WHAT BRINGS YOU HERE TODAY?
Are you wondering what to do in today’s market?
Perhaps you already have a clear mind of what you want to do?
In my blog, I often share stories of the challenges, triumphs, and lessons learned in my work as a real estate agent in Singapore.
Regardless of your situation, you can use me as a sounding board. I’ll provide perspective and clarity from my experience to help you make the most appropriate real estate decision in 2026.
